Scaling Covariates
At level 3 and 4 the program hides the size of numbers such as weight and age without hiding their shape. Each
scaled column is multiplied or divided by a hidden random factor. This page explains the idea, the difference between
level 3 and level 4, and the options --scale-range and --scale-columns.
1. One factor per column (level 3)
For every scaled column the program draws one random factor between 1 and 20 and one random operation (multiply or divide). Every valid number of the column is then multiplied or divided by that same factor.
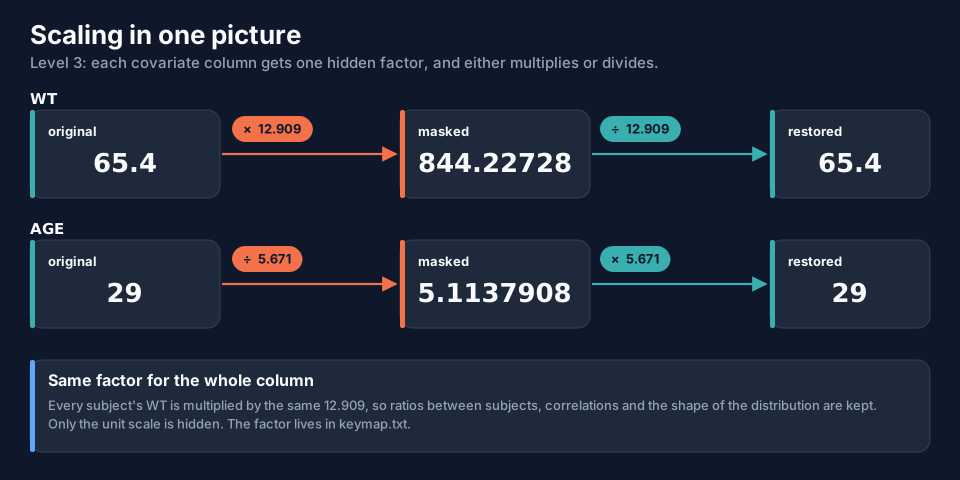
On the example dataset (seed 2026): every WT is multiplied by 12.909 (65.4 becomes 844.22728) and every AGE divided
by 5.671 (29 becomes 5.1137908). What this keeps and what it hides:
| Kept | Hidden |
|---|---|
| ranks, ratios between subjects, correlations, the shape of the distribution | the unit: a weight of 844 is not a weight in kilograms |
| a covariate that is constant within a subject stays constant | the real values |
The operation and the factor of every scaled column are written to keymap.txt (section 2, numeric scaling) so
reverse can apply the opposite operation. At level 3 this is exact.
Details that are easy to miss:
- Only valid numbers change. Text, blank cells and
.stay as they are;0stays0. - Results are written with up to 8 significant digits.
- Protected columns (
TIME,DV,AMT,EVID, ...) are never scaled. - Which columns count as covariates is decided from the name (
WT,WEIGHT,AGE,HT,HEIGHT,BMI,CRCL,EGFR,SCR,ALT,AST,BILI,ALB,BSA,LBWT);--scale-columnsadds more. - The masked values are no longer physiological.
llm.txttells the LLM which columns were rescaled so it does not flag them as implausible (page LLM Prompts and Tokens).
2. A factor for every value (level 4)
At level 4 the drawn factor is only the column's base. Every value gets its own factor: the base plus or minus 15 % (uniform). With a base of 5, every factor lies between 4.25 and 5.75.
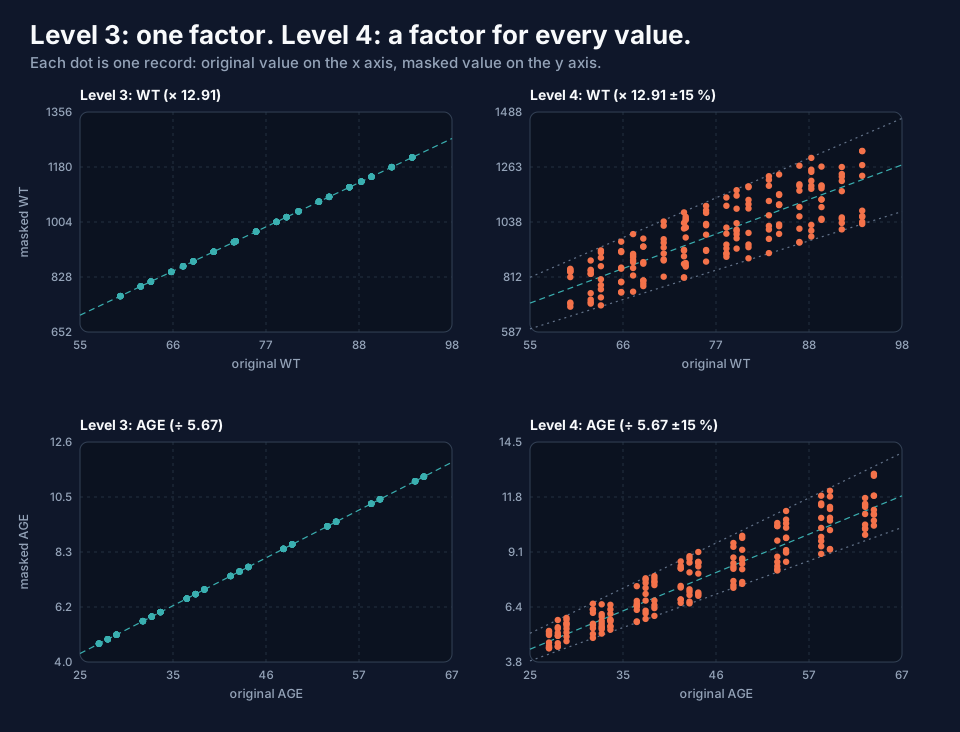
At level 3 the dots lie on a straight line: every value moved by the same factor. At level 4 they form a band: ratios between subjects are now only approximate, and the ranking is mostly, but not strictly, kept. A covariate that is constant within a subject now varies by up to about 15 % from row to row.
The factors that were actually used are in keymap_columns.txt:
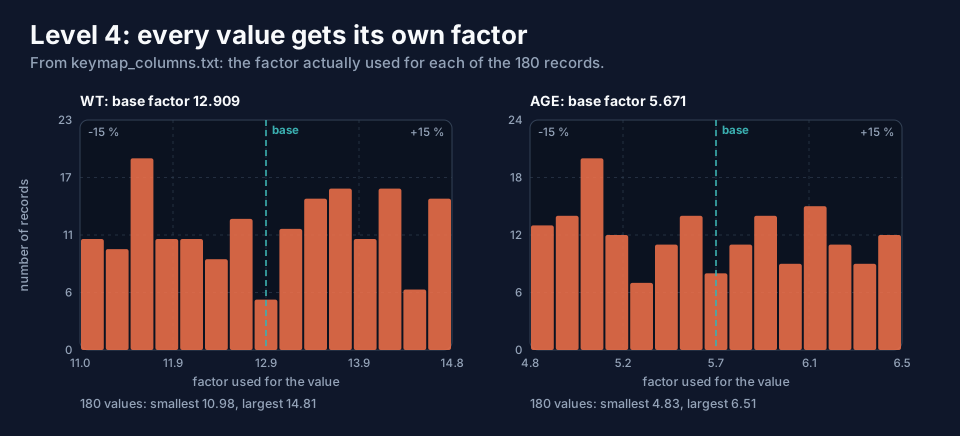
For WT (base 12.909) the factors lie between 10.98 and 14.81; for AGE (base 5.671) between 4.83 and 6.51. With the
per-value file, reverse restores every number exactly; without it, only to within about 15 % (page Restoring
Data: reverse).
The per-value factors come from a separate random stream seeded by --seed, so the same input, options and seed still
give a byte-identical dataset.
3. --scale-range: how big the factor may be
--scale-range MIN-MAX sets the window the factor is drawn from (default 1–20). At level 4 it is the window for the
base. A factor close to 1 hides little; raise the lower bound for stronger masking.
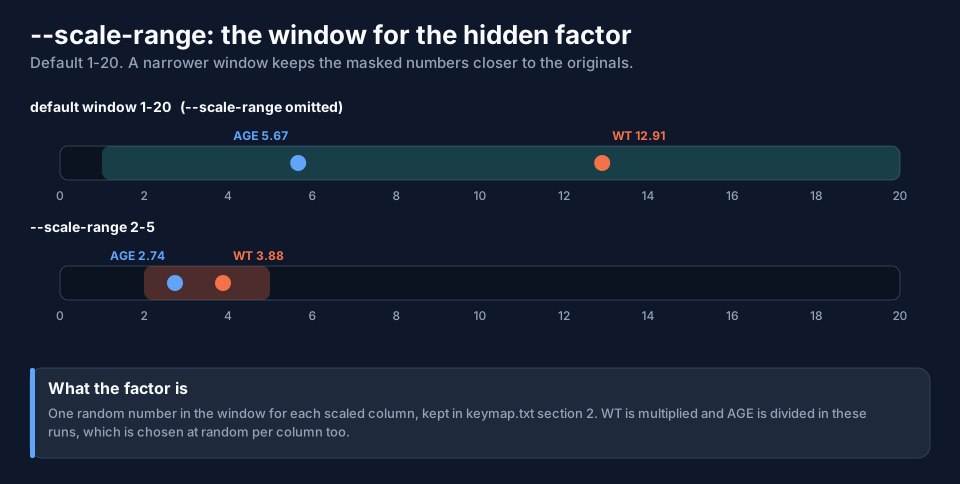
data-obfuscator run --input pk_study.csv --output ./masked --level 3 --seed 2026 --scale-range 2-5
With the window 2–5 the factors in the recorded run were 3.88 for WT and 2.74 for AGE, instead of 12.91 and 5.67.
--scale-range 3 (one number) fixes the factor at 3. --scale-range 5-20 is stronger than the default.
4. --scale-columns: scale a column the program does not know
The program scales the covariates it recognises by name. A column with another name, for example a frailty score
FRAILSCORE, passes through unchanged unless you name it. The example file pk_extra.csv has BMI (recognised
automatically), FRAILSCORE and LABNO:
data-obfuscator run --input pk_extra.csv --output ./masked --level 3 --seed 2026                          # FRAILSCORE untouched
data-obfuscator run --input pk_extra.csv --output ./masked2 --level 3 --seed 2026 --scale-columns FRAILSCORE
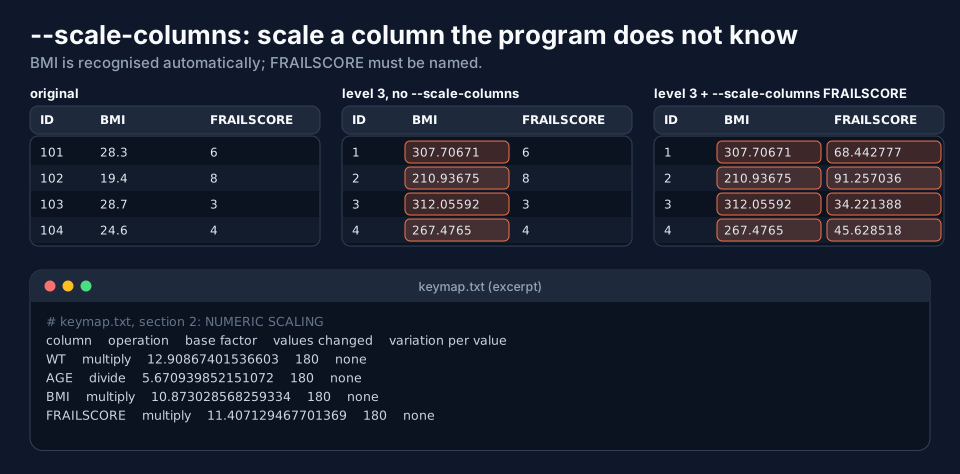
In the first run BMI is scaled (28.3 becomes 307.70671) but FRAILSCORE is not (6 stays 6); in the second FRAILSCORE
is scaled too (6 becomes 68.442777). The key records all of them:
column   operation  base factor         values changed  variation per value
WT       multiply   12.908674...        180             none
AGE      divide     5.670939...         180             none
BMI      multiply   10.873028...        180             none
FRAILSCORE multiply 11.407129...        180             none
--scale-columns also works in run2 (one factor per column name for all datasets); see the page about run2.
5. Choosing
| You want | Use |
|---|---|
| real covariate values | level 2 (no scaling) or --protect WT at level 3 |
| the unit hidden, relationships exact | level 3 |
| the unit hidden and ratios blurred | level 4, and keep keymap_columns.txt |
| a stronger factor | --scale-range 5-20 |
| a column the program does not know scaled too | --scale-columns NAME |
Next
Renaming and File Formats covers column names in the masked file and files that are not plain CSV.