Tutor
See pharmacokinetics and exposure–response move. Drag a slider, watch three populations diverge, and understand why.
Feel the equations, do not just read them
Textbook PK/PD is full of equations that are easy to read and hard to feel. The Tutor turns them into something you can play with, with three populations always side by side so every “what if?” has an immediate answer.
Halve a clearance, watch the curve climb
Change one population and see its curve rise above the others, live, on a shared chart.
Change the model structure
Switch from 1-compartment to 3-compartment, or to full target-mediated drug disposition, and see the distribution phase, terminal half-life and saturable clearance change.
Flip to exposure–response
Slide EC50 or the Hill coefficient to see why a steep curve makes small exposure differences matter so much.
Ask the reverse question
“What concentration do I need for an effect of 80?” The app inverts the model analytically and draws the answer on the chart.
Test yourself
Built-in quizzes with worked explanations and a “Try it” hint that points to the right slider.
Keep it
Install it like a native app, use it offline, and come back to find every setting where you left it.
Drag a slider, watch three populations diverge
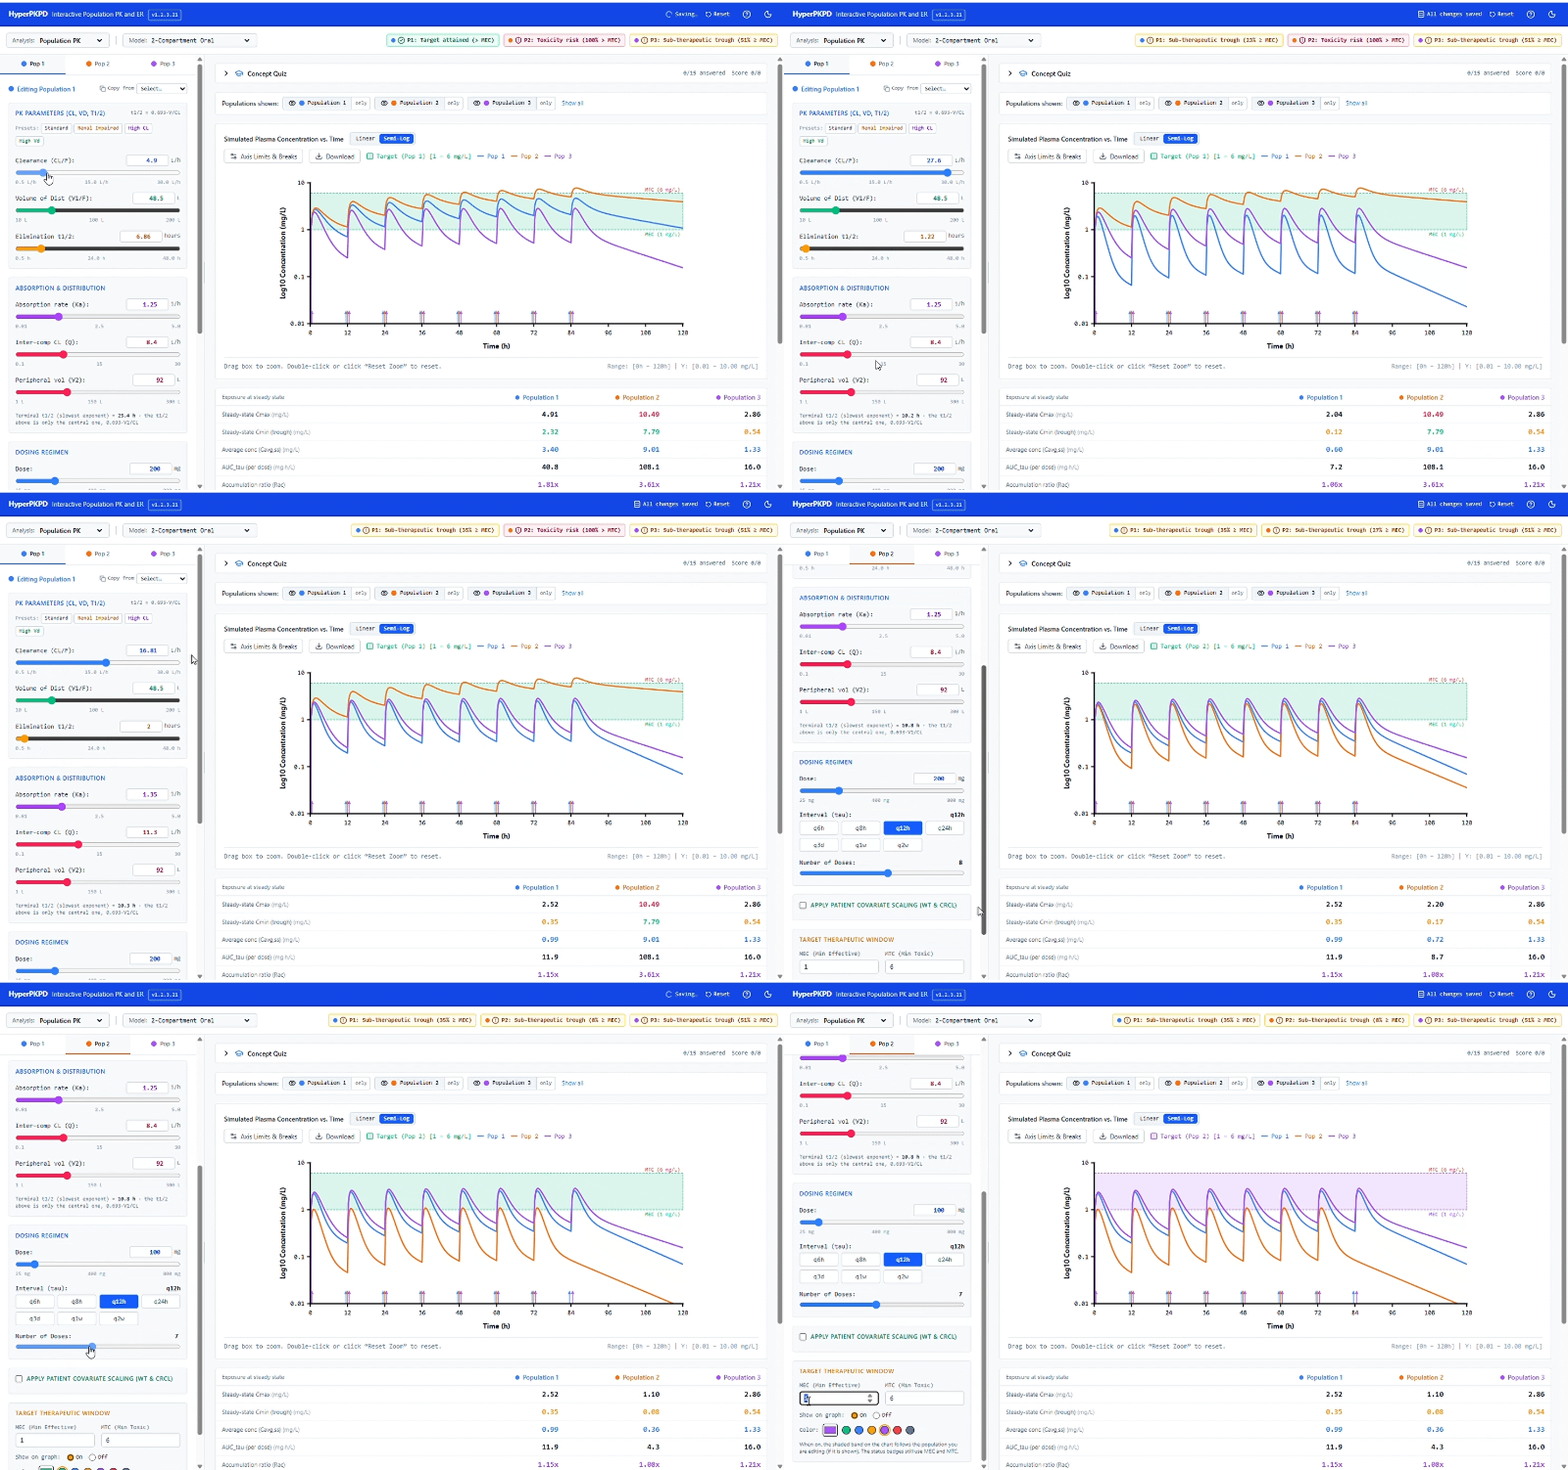
Three populations, one screen
Pick Analysis → Population PK. Each population has its own tab with a full set of inputs. Population 1 starts as a standard patient, Population 2 as renally impaired and Population 3 as high clearance.
| Model | Notes |
|---|---|
| 3-, 2- and 1-compartment oral | First-order absorption (Ka) from a gut depot |
| 3-, 2- and 1-compartment IV bolus | Instantaneous input to the central compartment |
| TMDD, 1- and 2-compartment | Full Mager–Jusko model: free drug, free target and drug–target complex; IV bolus or first-order SC; plot free or total drug |
Inputs per population
Clearance, volume and half-life (linked), absorption rate, inter-compartmental clearances, dose, dosing interval from q6h to q2w, number of doses, optional weight and creatinine-clearance scaling, and a therapeutic window (MEC and MTC). TMDD adds target, turnover, kon, koff, internalization and a “mAb defaults” button.
The chart
Concentration–time curves with dose markers and the therapeutic window shaded; linear or semi-log axes, drag-to-zoom, custom limits and a hover read-out, in a ggplot2 theme_classic look.
Steady-state table
True steady-state Cmax,ss, Cmin,ss, Cavg,ss, AUC over the interval, accumulation ratio and time above MEC for each population, with badges for toxicity risk or a sub-therapeutic trough.
Equations panel
The differential equations and integrated solutions for the selected model, parameter linkage, superposition and steady-state formulas with your numbers substituted, and the core assumptions.
Five models, solved both ways
Pick Analysis → Exposure Response. The model selector, parameter panel, chart, table, equations and quiz all follow.
| Model | Equation |
|---|---|
| Linear | E = E0 + β·C |
| Log-linear | E = E0 + β·ln(C) |
| Emax | E = E0 + Emax·C / (EC50 + C) |
| Sigmoidal Emax (Hill) | E = E0 + Emax·C^γ / (EC50^γ + C^γ) |
| Hockey-stick (threshold) | E = E0 for C ≤ Ct; E = E0 + β·(C − Ct) for C > Ct |
Reference exposure
Use each population’s Cavg,ss, Cmax,ss or Cmin,ss from its PK simulation, or type a concentration. Change the dose on the PK side and see the effect on the ER side.
Target effect
Enter the effect you want and get the required concentration, solved analytically for every model, with clear messages when a target is below baseline, above the plateau or already met.
Table
Predicted effect, change from baseline, % of maximal effect, C/EC50, local slope dE/dC, effect change per doubling of exposure, EC50/EC90 or threshold status.
Equations panel
Model equation with derivative and inverse, live worked values for the population you are editing, and a summary table of all five models.
89 questions that explain themselves
A collapsible quiz sits above the chart. Each round draws random questions from a pool, shuffles the answers and explains every one.
Seven things to try
- See a dose-response in PKOpen the app (default: 2-compartment oral). Pop 2’s curve sits well above the others; hide Pop 1 and 3 to look at it alone.
- Fix an overexposed populationRaise the dosing interval or lower the dose until the status badge turns green.
- Change the structureSwitch to 3-compartment IV bolus and read the terminal half-life.
- Go non-linearChoose TMDD 2-compartment, click “mAb defaults (all)”, and notice that doubling the dose no longer doubles exposure.
- Switch to exposure–responsePick Sigmoidal Emax (Hill) and raise γ from 1 to 4: the same exposures now land on a much steeper part of the curve.
- Ask the inverse questionSet a target effect of 80 and read the required concentration.
- Quiz yourselfTake a round, then press Install app to keep it on your desktop.
Private, installable and remembers everything
Private by design
No backend and no analytics: calculations run in your browser and nothing leaves your device.
Remembers everything
Every setting is saved in your browser and restored on reload. A Reset button restores factory defaults.
Installable and offline
A progressive web app: install from Chrome, Edge or Samsung Internet, or use Add to Home Screen on iPhone and iPad. After the first visit it works offline.
Resizable, light and dark
Drag the divider between the parameter panel and the charts; switch between light and dark themes.
Checked against independent solutions
- The general linear solver matches independent fine-step ODE solutions to about 1e-13, with and without covariate scaling.
- Linear steady-state metrics match a brute-force 300-dose simulation, and Cavg,ss equals Dose/(CL·τ) exactly.
- TMDD curves match an independent fine-step Runge–Kutta solution to 1e-4 relative or better, and TMDD steady states match long brute-force runs.
- Exposure–response slopes were checked against numerical derivatives and inverses against round-trip evaluation.
- Every numeric answer in the quizzes was recomputed independently from the model equations.
The Tutor is an educational tool. It is not validated for clinical decision-making, dose selection or regulatory work. Parameters are typical population values with no between-subject variability or residual error, bioavailability is taken as 1, and TMDD assumes 1:1 binding in the central compartment.
Frequently asked questions
What is the Tutor?
The Tutor is a free interactive simulator for population pharmacokinetics and exposure–response. Drag a slider, watch three populations diverge on one chart, and learn why with built-in equations and quizzes.
Does it upload or store my inputs?
No. There is no backend and no analytics. Calculations run in your browser and nothing leaves your device. Settings are saved in your browser only so the app can restore them on reload.
Do I need to install anything?
No. It runs in the browser with no sign-up. You can optionally install it as an app, and after the first visit it works offline.
Which models does it include?
Population PK: 1-, 2- and 3-compartment oral and IV bolus models and 1- and 2-compartment TMDD. Exposure–response: linear, log-linear, Emax, sigmoidal Emax (Hill) and hockey-stick.
Can I use it for dose selection or regulatory work?
No. It is an educational tool and is not validated for clinical decision-making, dose selection or regulatory work.
Where is the source code?
The Tutor’s code is on GitHub at HyperPKPD/tutor-ui.